This is stage 5 of the Quick Start example for Machine Control Studio.
In this stage the example program is monitored as it executes on the Unidrive M onboard target.
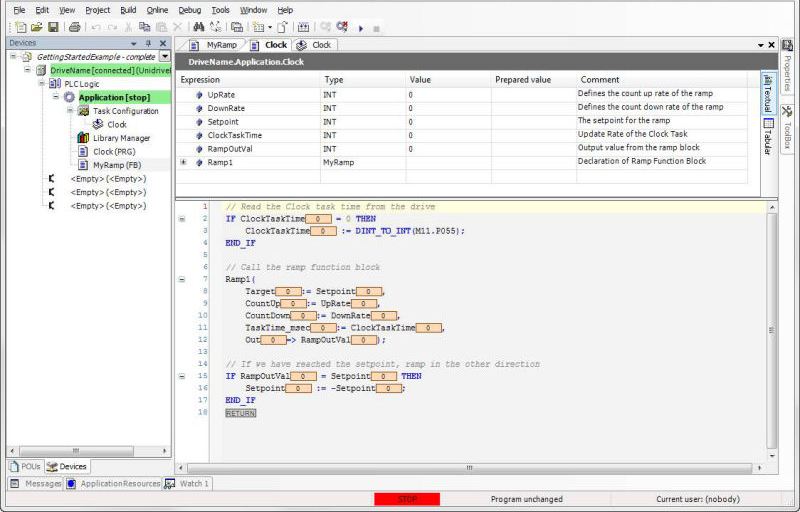
When online, Machine Control Studio adds some new functionality to the user interface. See Figure 38 below for an example.

Figure 38 – Machine Control Studio while Online
Notice a few changes to the display:
| • | The Device Name and Application are highlighted in green on the Devices tree. This indicates that they are the active Device and active Application on the device. |
| • | In a program or function block editor view, the Variable Declaration section turns into a Watch Window, allowing you to monitor and modify variable values within that program or function block. Note that the Name, Data Type, and Comment all are displayed in the watch window as well. |
| • | The Code Section of the program or function block editor now shows online values for each of the variables within the program. |
| • | The Status Bar along the bottom of the interface shows the operating status of the tasks/programs. By default, after downloading, the Status should indicate “STOP” meaning that the application is not running. |
Now that the project has been downloaded, and Machine Control Studio is online with the target, we are ready to run the application. The user has several options on how to run the application:
| • | Select Debug > Start from the Menu Bar |
| • | Press the F5 key on your keyboard |
| • | Press the Start icon |
Choose one of the above methods to run/start the application. Once started, you should notice that the Status Bar changes to “RUN” in green, and the variables in the program will begin to change values.
Note that the project can be configured to run automatically on power-up or reboot by setting M11.P047 to a value of Run (1), and saving the drive parameter set. Use caution whenever configuring the program to run automatically on power-up or reboot, as it could lead to unexpected behavior for those not familiar with the system operation.
The program should now be running. Be sure to click on the Clock Program tab to monitor the operation of the program. You can now monitor the value of the RampOutVal variable in the Clock program. The RampOutVal should ramp up towards the Setpoint value of 5000. When it reaches 5000, the Setpoint should automatically change to -5000, and the RampOutVal should ramp down to -5000. The program should continue in that capacity, ramping back up and then down, repeatedly.
After monitoring the Clock Program, you can also look inside the Ramp1 Function Block to see what it is doing. Click on the MyRamp along the top of the interface, or if it isn’t still open as a tab, simply double-click it in the Devices tree. You will then see the operation of the ramp Function Block along with a watch window for each of its internal variables.
Note that if multiple instances of the MyRamp Function Block had been used in a program, you can double-click on the MyRamp object in the Devices tree, and Machine Control Studio will pop up a dialog asking you which instance of the function block you with to monitor/debug.
We will now modify the Setpoint and one of the Ramp values while online. Navigate back to the Clock program. While on this view, we will modify the Prepared Value for the Setpoint variable in the watch window as seen in Figure 39 below.

Figure 39 – Modifying the Prepared Value of “Setpoint”
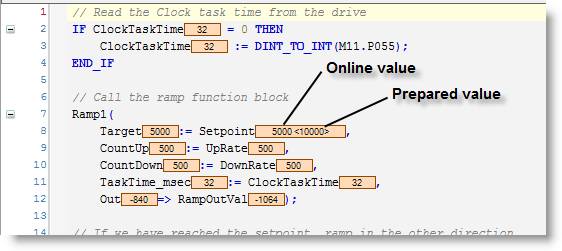
Enter the new desired value for the Setpoint variable into the Prepared Value field (try using the value 10000). Press Enter on your keyboard to apply the value to the editor. Note that this does not send the new value to the variable yet. At this point, if you look at the value of the variable within the program, it will show its actual online value as well as the Prepared Value in <braces> as seen in Figure 40 below.

Figure 40 – Prepared Value Appears in Braces
To apply (or Write) the Prepared Value to the program, either select Debug > Write Values from the Menu Bar, or press Ctrl + F7 on your keyboard. The value will then be written to the program and take effect immediately. If this process has worked, you should notice that the ramp now ramps to the new Setpoint value of 10000 instead of the initial value of 5000.
Repeat the same process for one of the ramp rate parameters (UpRate or DownRate). Set one of them to 2000 and Write Values to apply it to the program. Watch how the ramp now ramps much faster in the direction that you modified.
The Watch Windows that are created automatically in the Variable Declaration section are great for monitoring the variables within a given program or function block. However, imagine a scenario of a project containing several programs and up to 20 or more function blocks. What if you want to monitor a variable from several different programs or several different function blocks? How do you do this without jumping between screens every time you want to see a different variable? This can be done by creating your own customized Watch Window.
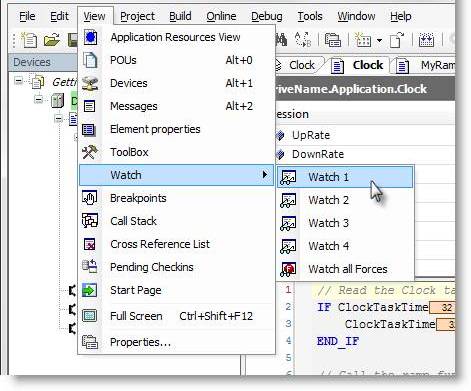
To create your own Watch Window, select View > Watch > Watch 1 as seen in Figure 41 below.

Figure 41 – Creating a Custom Watch Window
This should cause Machine Control Studio to display a new watch window area in the user interface. You can undock and move the new window to the desired location or leave it in its default position. When the window appears, click in the Expression field and begin typing the name of the variable you wish to display in the window. NOTE: you must prefix the name of the variable with the name of the program or function block the variable is declared in. For example, the variable Setpoint must be referred to as Clock. Setpoint since it is declared within the Clock program. Once you begin typing, you should see the Intellisense list appear allowing you to select the desired item from a dropdown list of available objects. Once you have entered the desired variable, press enter on the keyboard to add the variable to the watch window. You may notice that Machine Control Studio changes the variable name to the fully qualified system name. For example, Clock.Setpoint becomes, DriveName.Application.Clock.Setpoint. Each of these items can be defined by the user: Drive Name, Application Name, Program (or POU) Name, and Variable Name. They are combined and separated by dots to make up the fully qualified system name. You should then see the new variable in the Watch 1 watch window as seen in Figure 42 below.

Figure 42 – Variable Added to a Watch Window
Note how the Watch Window also displays the Data Type, Prepared Value and Comment from the variable declaration. This can be helpful information to determine if you have selected the correct variable to display. You can also use this Watch Window to prepare values for variables in multiple programs and/or function blocks so that they can all be written simultaneously.
An alternate method to add variables to the watch window is to double-click in the Expression field and then click on the search utility icon ![]() on the right side of the field. This will launch the Input Assistant which allows you to find the desired Watch Variable and click OK to add it to the list.
on the right side of the field. This will launch the Input Assistant which allows you to find the desired Watch Variable and click OK to add it to the list.
Note that if you select a Function Block as a variable to display in the Watch Window, you will have the ability to expand and collapse the block. When expanded, you automatically see all of the variables inside the function block in your Watch Window without having to add them each individually.
The final monitoring/debugging tool to be discussed is the Cross Reference List. This tool helps to debug a program by allowing you to list all the spots in all programs or function blocks that a particular variable is used or referenced. To view the Cross Reference List, select View > Cross Reference List from the Menu Bar. This should cause Machine Control Studio to display the Cross Reference List in the user interface. You can undock and move the new window to the desired location or leave it in its default position. When the window appears, click in the Name field and begin typing the name of the variable you wish to search for. Note that you do not need to further qualify the name by prefixing it with the program or function block name. Once the variable name is entered, press the magnifier glass icon to find all references of the variable. See Figure 43 below for an example.

Figure 43 – Cross Reference List
In this example, the variable Setpoint was searched. The Cross Reference List returned five references of that variable. Note in the Access column, that the first item in the list is the Declaration of the variable. The remaining items in the list are cases where the variable is read or written within the program or function block code.
This is the end of the Quick Start example. If you wish to save the project and the other settings that have been made on the fly, select File > Save Project from the Menu Bar or click the Save icon on the toolbar. The Project can now be closed.
The previous Quick Start stage was: